QR Code Error Correction: How Damaged Codes Still Scan
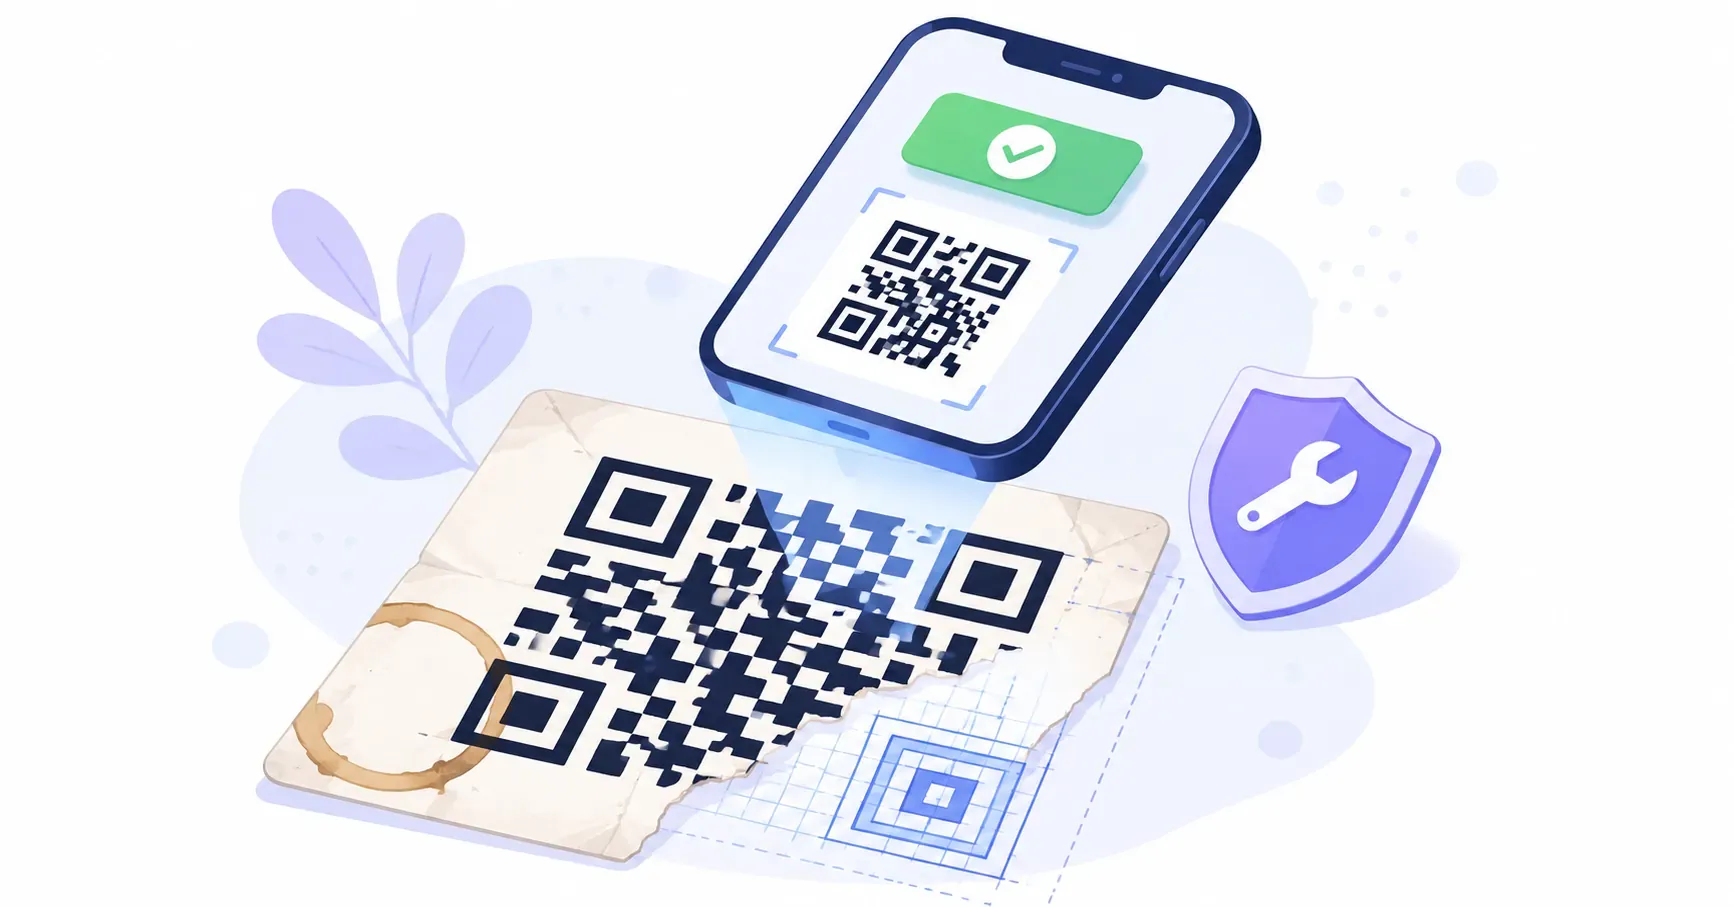
Spill coffee across a QR code on a flyer, and the ring stain wipes out a chunk of the pattern. Slap a company logo dead in its center, and more squares vanish. Yet the code still scans on the first try. That everyday resilience isn’t luck — it’s QR code error correction, a layer of mathematical redundancy baked into every code that lets a scanner rebuild data it can no longer see.
This guide explains how that recovery works without the heavy math, walks through the four correction levels and their exact damage tolerances, and shows which level to pick for screens, outdoor signage, or a logo overlay. By the end, the reason a scratched code keeps working will feel obvious rather than magical.
What Is QR Code Error Correction?
QR code error correction is a built-in safeguard that stores extra, redundant data inside the code so a scanner can recover the original information even when part of the code is missing or unreadable. Think of it as spare copies of the message, woven into the pattern itself.
Every code reserves a portion of its modules — the small black and white squares — for this recovery data rather than the actual content. When your camera reads a damaged code, the decoder uses those spare modules to mathematically reconstruct the lost pieces. The feature is part of the official QR standard, ISO/IEC 18004, first developed by Denso Wave, the code’s Japanese inventor, in 1994 — so it works identically across every compliant scanner and generator. That’s why a code created years ago on one tool still reads on a brand-new phone. To back up a step on the fundamentals, our explainer on what a QR code is covers how the pattern encodes data in the first place.
Reed-Solomon in Plain English
The math behind the recovery has a name: Reed-Solomon error correction. Named after Irving Reed and Gustave Solomon, who published it in 1960, it’s the same family of coding used on CDs, DVDs, and deep-space satellite links — anywhere data has to survive scratches or interference.
Here’s the idea without the equations. Imagine writing down an important phone number, then also jotting a few “check” numbers derived from it — sums and combinations that let a friend figure out any digit you later smudge. Reed-Solomon does this with the code’s data: it generates extra codewords, or blocks of recovery data, from the original content. If some original blocks get destroyed, the decoder solves for the missing values using the spare ones.
The elegance is that it doesn’t matter which modules are lost — a stain in the corner, a scratch across the middle, a logo on top. As long as the total damage stays within the level’s budget, the Reed-Solomon math in the QR code fills the gaps and the scan succeeds.
The Four QR Code Error Correction Levels (L, M, Q, H)
Every QR code is built at one of four correction levels, labeled L, M, Q, and H. Each reserves a different share of the code for recovery data, which sets how much damage the code can absorb:
| Level | Name | Recoverable Damage | Typical Use |
|---|---|---|---|
| L | Low | ~7% | Clean screens, digital-only |
| M | Medium | ~15% | Standard print, the common default |
| Q | Quartile | ~25% | Outdoor, handled, or dusty surfaces |
| H | High | ~30% | Logo overlays and harsh environments |
Those percentages describe how many of the code’s codewords can be corrupted while the content still recovers. A level-H code can lose roughly 30% of its data and keep working — a wide margin that makes the logo trick possible. The trade-off is that all that recovery data has to go somewhere, which is the subject of the next section.
The Trade-Off: More Protection, Denser Code
Nothing is free. Every recovery module you add is a module that can’t hold actual content, so raising the correction level forces the code to grow.
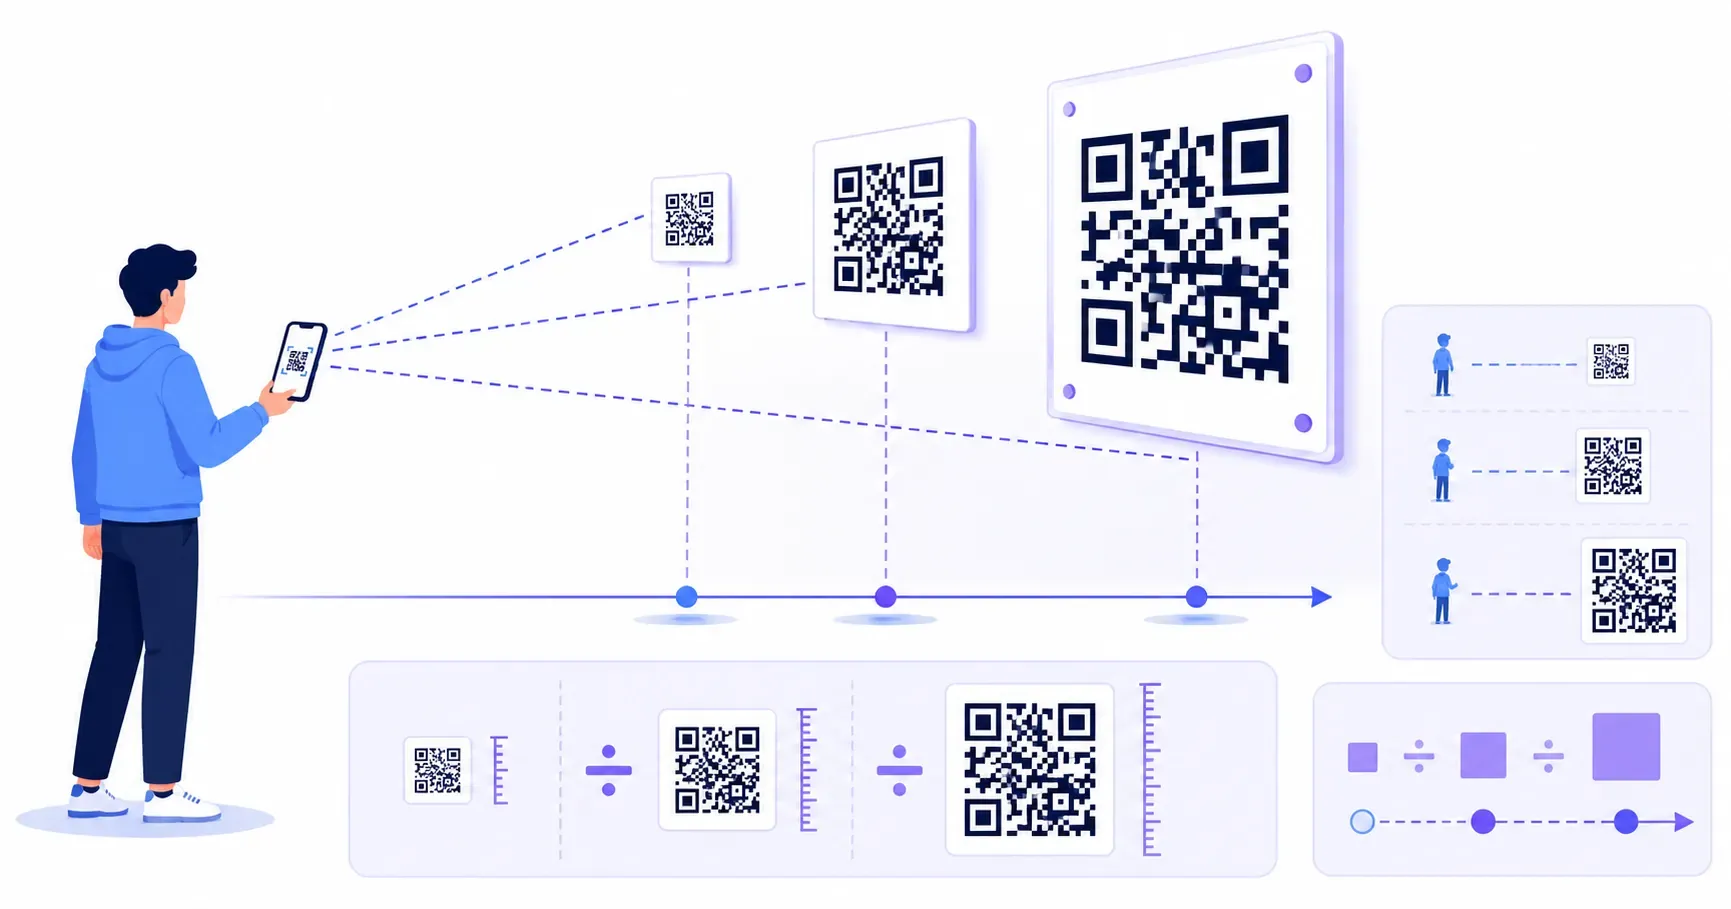
Picture two codes carrying the same web address, printed at the same physical size. The level-L version uses fewer modules, so each square is larger and easier for a camera to resolve. The level-H version packs in far more modules — the extra 23 percentage points of damage tolerance over level L have to be stored somewhere — so each square shrinks. Denser codes demand sharper printing and more careful sizing to stay scannable.
This is why you can’t just default everything to level H to play it safe. At small print sizes, an H-level code’s tiny modules can blur past the point of recognition, especially on low-resolution printers. The right move is to match the level to the risk, and to size up when you raise the level. Our QR code size guide covers the exact dimensions that keep a denser code readable.
Which Level Should You Choose?
Match the level to where the code will live and how rough its life will be.
Screens and Clean Print: L or M
For a code shown on a website, in a slide deck, or on a clean printed page that nobody touches, level M is the sensible default — it shrugs off minor print imperfections while keeping the module count low. Level L works for purely digital placements where damage is essentially impossible, but the space savings are rarely worth dropping below M for anything printed.
Outdoor and High-Wear Surfaces: Q
A code on a park sign, a delivery box, a restaurant table, or a product label lives a harder life — rain, scuffs, fingerprints, and fading ink. Level Q’s roughly 25% tolerance gives it the margin to survive that wear. If a code will be handled, weathered, or printed on a curved surface, Q is the safe choice.
Logos and Design Overlays: H
Any time you cover part of the code with a logo, an icon, or a decorative element, reach for level H. The overlay destroys the modules beneath it, and only H’s ~30% budget reliably absorbs that loss plus everyday wear on top.
Pick your level and see the pattern change live — free, no sign-up. — Create Your Free QR Code
QR Code Error Correction and Logos
Here’s what actually happens when you drop a logo into the middle of a code: you are deliberately destroying data. Every module the logo covers is one the scanner can no longer read. It works anyway because error correction treats that logo exactly like damage and rebuilds the hidden data from the surrounding recovery modules.
The useful mental model is a “damage budget.” At level H, your code can lose about 30% of its modules in total. A centered logo might consume 10–15% of that budget, which leaves comfortable headroom for scratches, poor lighting, and print drift. Push the logo much larger and you spend the whole budget on the logo alone, leaving nothing for real-world wear — and the code starts failing. The step-by-step method for sizing and placing one lives in our guide to adding a logo to your QR code. Worth noting: QRocket raises the error correction level automatically when you add a logo, so you don’t have to remember to switch to H yourself.
Seeing It Work: A Damage Test You Can Try
Don’t take the percentages on faith — prove them in about two minutes. Print any code, such as one from QRocket, at level H, scan it once to confirm it works, then cover a corner with a sticky note. Scan again. It still opens, because you’ve only removed data the recovery modules can replace.
Now try the revealing failure. Cover one of the three large squares in the corners — the finder patterns a scanner uses to locate and orient the code — and try again. This time it fails. Those finder patterns aren’t protected content; they’re the reference marks the decoder needs before error correction can even begin. The lesson sticks: redundancy protects your data, but not the structural anchors that make the code readable in the first place.
Closing Insight: Designed for the Real World
The quiet genius of QR codes is that they were built assuming the world would damage them. A pristine code in a lab was never the design target — a smudged, sun-faded, logo-stamped code on a real package was. That’s why the four levels exist, and why choosing the right one is less about maximum protection than about honest math: enough redundancy for the abuse the code will face, and no more. Run the sticky-note test on a QRocket code of your own, and watching a wounded code still scan will do more to convince you than any percentage on a chart.
Create a free QR code with custom colors, your logo and print-ready downloads — no sign-up.